A Confusion Matrix is an important tool for measuring the performance of a predictive model. It is a tabular representation of the actual and predicted labels or outcomes in a classification problem, which can help evaluate how well a predictive model is performing.
Matrix
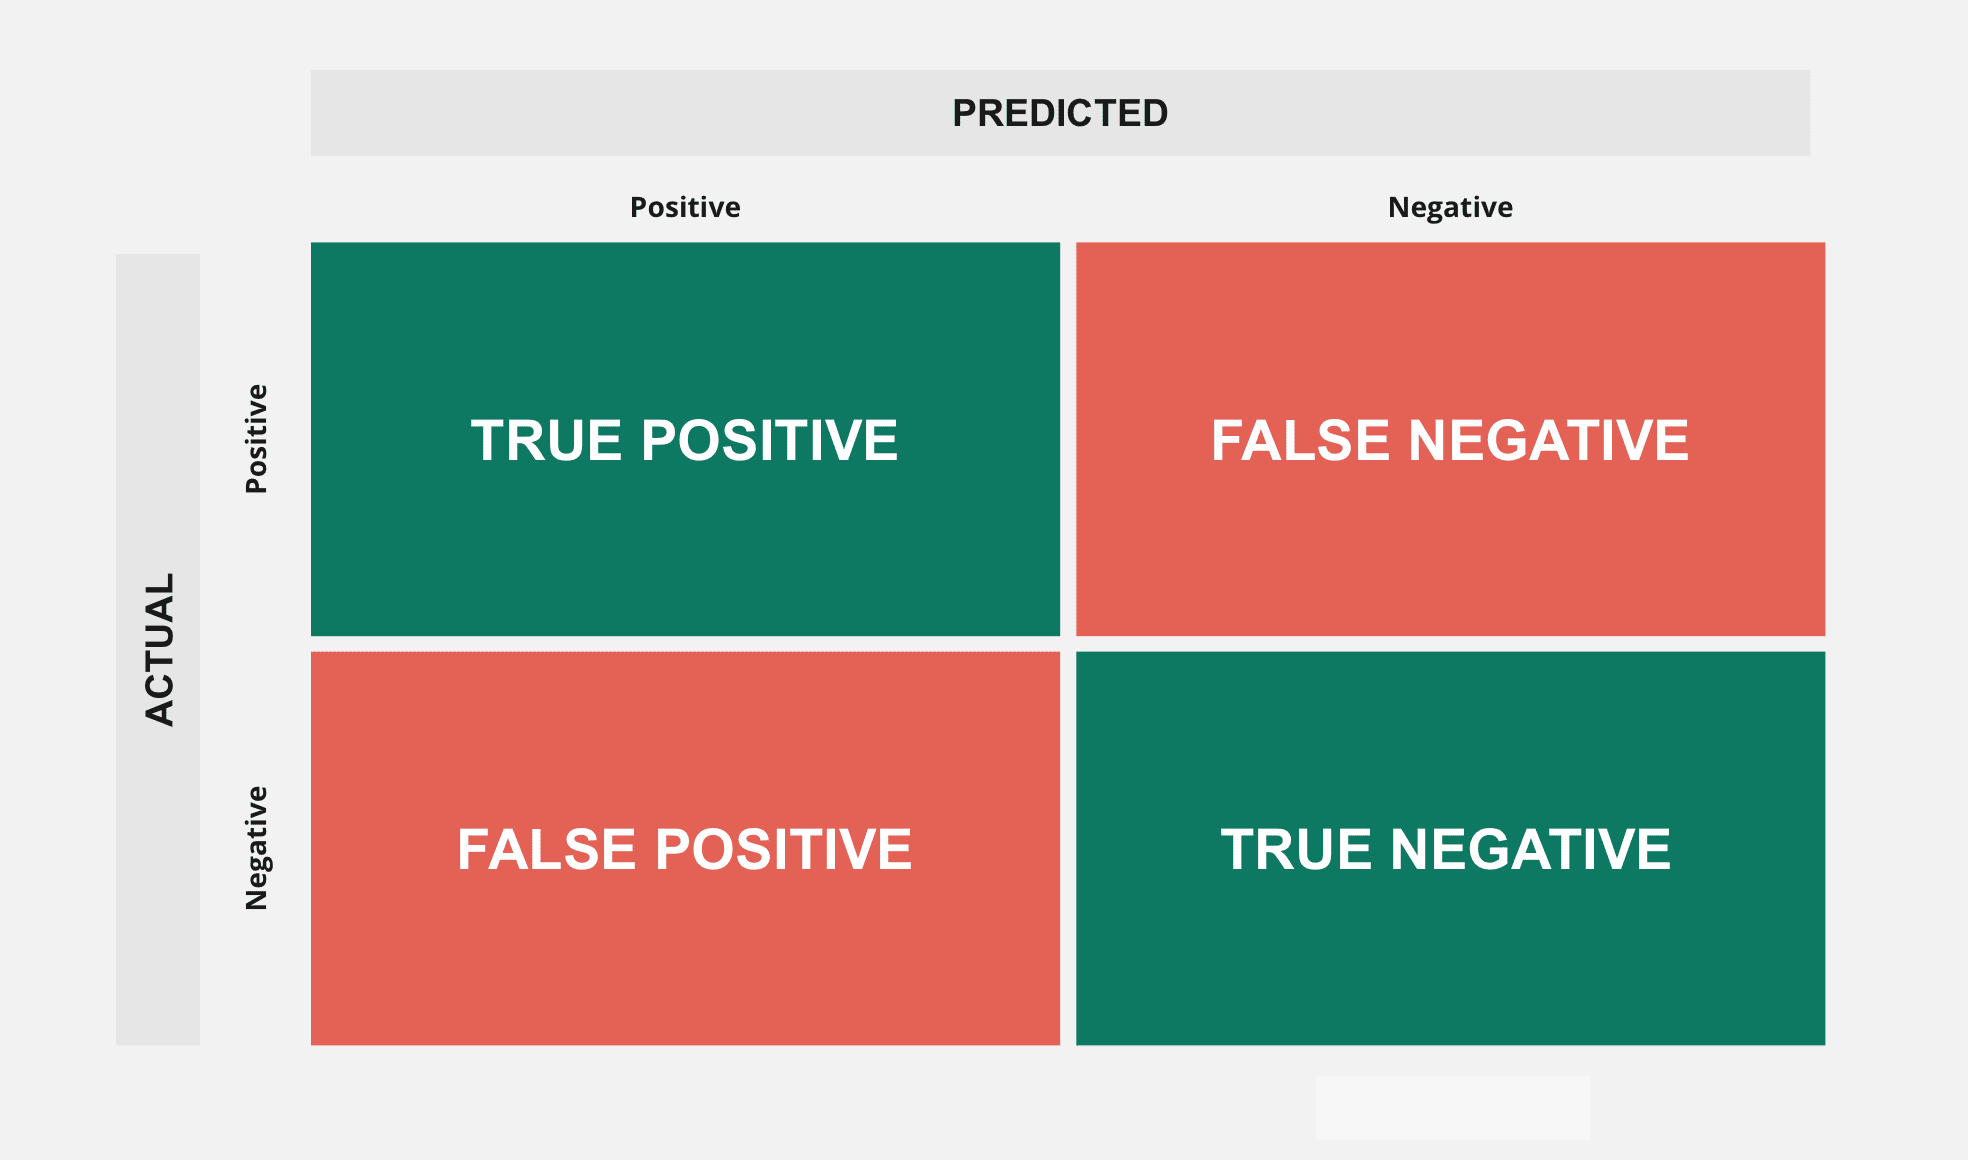
The matrix consists of four cells representing true positives, false positives, false negatives, and true negatives. True Positives (TP) are the number of times a label was correctly predicted as positive by the model. False Positives (FP) are the number of times that a label was erroneously predicted as positive even though it was actually negative in nature.
Classification of Matrix
False Negatives (FN) are when an instance should have been classified as positive but was instead classified as negative by the model. Lastly, True Negatives (TN) indicate that instances that were correctly classified as negative by the model.
Confusion Matrix
The Confusion Matrix provides several measures that can be used to evaluate the performance of a predictive model such as precision, recall, accuracy and specificity. Precision is determined by dividing TP by (TP + FP) and it indicates how many selected items are relevant; recall is measured by dividing TP by (TP + FN) which reflects how many relevant items were retrieved; accuracy looks at how many correct predictions were made overall; and specificity compares TN to (TN + FP), indicating how many correct negatives there were in total.
In addition to these measures, other metrics such as F-measure, Matthews Correlation Coefficient and Area Under Curve can also be calculated from confusion matrix to better assess its predictive performance. F-measure combines precision and recall into one measure whereas Matthews Correlation Coefficient evaluates the quality of binary classifications independent from class distribution whilst AUC computes area under an ROC curve which considers all possible thresholds for calculating true positives rates against corresponding false positive rates.
Essential Tool
Overall, Confusion Matrix is an essential tool when evaluating models in machine learning problems due to its ability to quickly provide insights into their relative performances through useful measures such as precision, recall and accuracy in order to identify any potential issues or areas for improvement on future iterations.
It is a table with four different combinations of predicted and actual values: true positives, false positives, true negatives, and false negatives. While it is an essential tool for model evaluation, it has its advantages and disadvantages.
Advantages of Confusion Matrix
- It is a simple and easy-to-understand tool for evaluating the performance of a classification model.
- It provides insights into the strengths and weaknesses of the model by showing the correct and incorrect classifications.
- It measures different performance metrics such as accuracy, precision, recall, and F1 score, which can help in identifying the best model for a specific task.
- Confusion Matrix can be used for multi-class classification problems as well.
Disadvantages of Confusion Matrix
- It can be limited in its ability to evaluate the performance of the model when the classes are imbalanced. In such cases, accuracy may not be a reliable metric as it can be skewed by the majority class.
- It does not provide information on the costs associated with misclassifications, which can be critical in real-world applications.
- Confusion Matrix does not consider the relationships between classes and may not capture the nuances of complex classification problems.
Summary
In some cases, the use of a confusion matrix may be constrained by ethical considerations, such as in the case of medical diagnosis and decision-making. In conclusion, while the confusion matrix is a useful tool in evaluating the performance of machine learning models, it is important to consider its limitations and use it in conjunction with other evaluation techniques to get a more comprehensive understanding of the model’s performance.