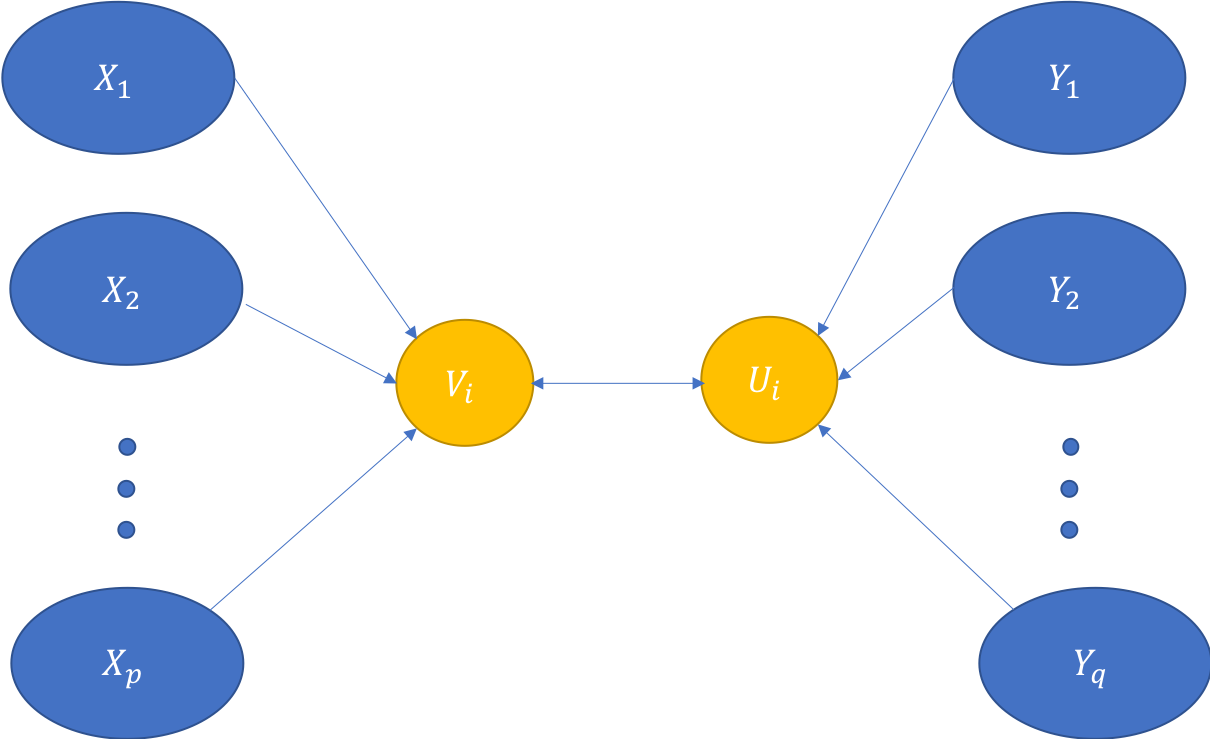
Canonical Correlation Analysis (CCA) is a multivariate statistical technique used to uncover the linear relationship between two sets of variables. It is used to explore the correlation between two or more sets of variates and identify which variates contribute most highly to the correlation among all variables. CCA seeks to maximize the correlation between two sets of variables by transforming them into canonical variates. Canonical variates are obtained through a series of mathematical operations involving the principal component analysis (PCA) of each set of data points. By analyzing both sets simultaneously, CCA can pinpoint relationships between them that may be missed when studying either one in isolation.
Procedure of Performing Canonical Correlation Analysis
The procedure for performing CCA involves three steps: first, perform PCA on each set of data points; then use the resulting eigenvalues and eigenvectors to calculate the canonical correlations; lastly, examine and interpret the results.
Calculation of CCA
To calculate the canonical correlations, we must first calculate what is known as the canonical variate matrix (CVM). This matrix contains information about how much each variable contributes to its respective set’s correlation with its partner set’s variance. After obtaining this matrix, we can compute a number of measures such as redundancy ratios, partial correlations, and multiple R-squared values that tell us how much variation in each set can be explained by its partner set. Once we have calculated our correlations and examined their significance via statistical tests, we can then interpret our results by examining which variables are most highly correlated with each other across both sets. We can also look at how much they contribute to explaining common variation in either or both datasets. By understanding these relationships we gain insight into how different factors interact in an area of study and can use this information to make informed decisions regarding further research or applications requiring knowledge about particular associations or effects.
Advantages and Disadvantages of CCA
One of the advantages of CCA is that it can help researchers identify complex relationships that may not be apparent with other statistical methods. For example, CCA can be used to identify the relationship between two datasets that have different units of measurement, such as the relationship between weather patterns and crop yields. CCA can also be used to identify the underlying factors that influence consumer behavior or employee satisfaction. Another advantage of CCA is that it can provide a dimensionality reduction technique that can help simplify the analysis of large datasets. By identifying the most important relationships between variables, CCA can reduce the number of variables that need to be analyzed, which can save time and reduce the risk of overfitting the data.
In addition to providing deeper insights into data relationships than traditional techniques such as Pearson’s Product Moment Correlation Coefficient (PMCC), CCA also offers several advantages over other methods such as factor analysis (FA). Unlike FA, CCA does not require restricting assumptions about linearity or orthogonality between variables; instead it allows for nonlinear relationships without having to impose any specific shape on them beforehand. Furthermore, since it uses PCA for both sets of data points simultaneously rather than separately like FA does, this technique provides a more accurate picture of associations across different datasets than standard PCA alone would provide when applied separately on each dataset being studied. Canonical Correlation Analysis (CCA) is a multivariate statistical technique designed to analyze the relationship between two sets of variables. It aims to identify the linear combinations of two or more variables that have the highest correlation with each other.
Disadvantages
However, there are also some limitations to CCA. One of the main disadvantages is that it assumes a linear relationship between the sets of variables being analyzed. This means that it may not be effective in identifying non-linear relationships, such as those that may exist between genetic traits and health outcomes. Moreover, CCA requires a relatively large sample size to produce accurate results. If the sample size is too small, there may be insufficient evidence to support the identified relationships between the variables. Additionally, CCA cannot be used to establish causation between variables, only correlation. In summary, CCA is a powerful statistical method that can help researchers identify complex relationships and simplify the analysis of large datasets. However, it is not suitable for all types of data and requires a relatively large sample size to produce accurate results.