An Asymmetrical distribution, also known as skewed distribution, is a statistical term that describes a distribution that is not symmetrical around its mean value. In other words, the shape of the distribution is skewed towards one end or the other. An asymmetrical distribution occurs when the values in a dataset or population are not evenly distributed around an average. These distributions may have more occurrences of some values and fewer occurrences of other values, resulting in an irregular shape when plotted on a graph.
Types of Asymmetric Distribution
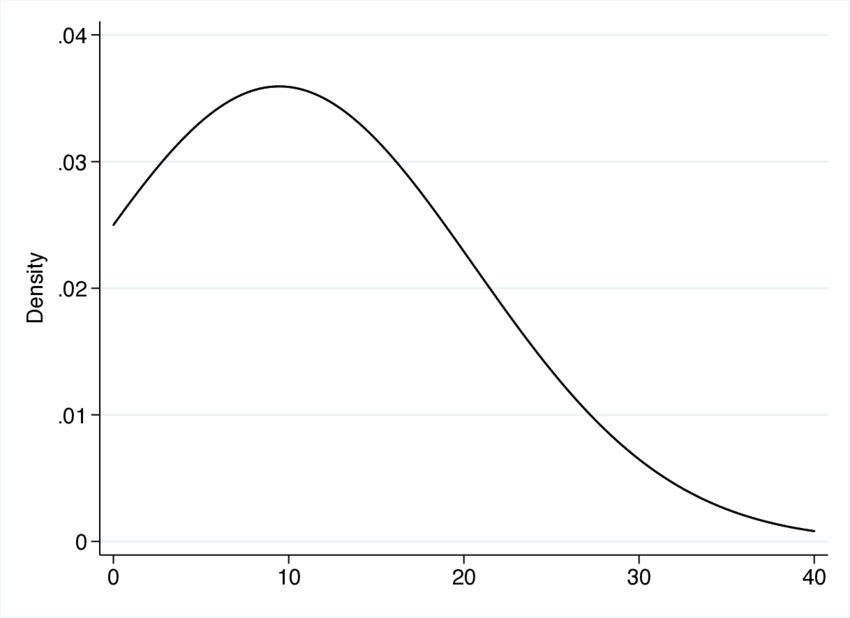
Asymmetrical distributions can be either positively or negatively skewed. Positively skewed distributions have a longer tail on the right side, which means that most of the values are concentrated on the left side of the graph and there are very few extreme values on the right side. On the other hand, negatively skewed distributions have a longer tail on the left side, so most of the values tend to be concentrated on the right side with very few outliers on its left.
Examples
One of the most well-known examples of positively skewed distribution is the distribution of income. In most countries, a small number of individuals at the top of the income scale make significantly more than the rest of the population. This creates a long tail to the right, resulting in a positively skewed distribution. It is important to note that asymmetrical distribution can have a significant impact on statistical analyses. For example, mean and median values can differ greatly in asymmetrical distributions. In positively skewed distributions, the mean is typically higher than the median, while in negatively skewed distributions the median is higher than the mean.
On the other hand, a common example of negatively skewed distribution is the distribution of grades in a class. If the majority of students receive high grades, the distribution will be negatively skewed with a long tail to the left. In addition to these two types of asymmetric distributions, there is also something called bimodal distribution which is an interesting type of non-symmetrical distribution where two different peaks appear in a histogram instead of one single peak. This type of distribution is usually caused by different populations that are combined together but it can also occur by chance. It should be noted that asymmetry can happen in any type of data set and is not limited to any specific type like frequency or probability distribution.
Asymmetry can also exist within different parameters such as time series data for stock prices or even individual variables like age or income level where certain values might occur more often than others. When analyzing data sets for asymmetry it is important to take into account both graphical (histograms) and mathematical (standard deviation) methods of analysis as both provide valuable insights into what kind of variance exists within your data set. Graphical methods allow you to visually identify patterns while mathematical measures quantify how far away from the average each value is and how much overall variance exists in your data set.