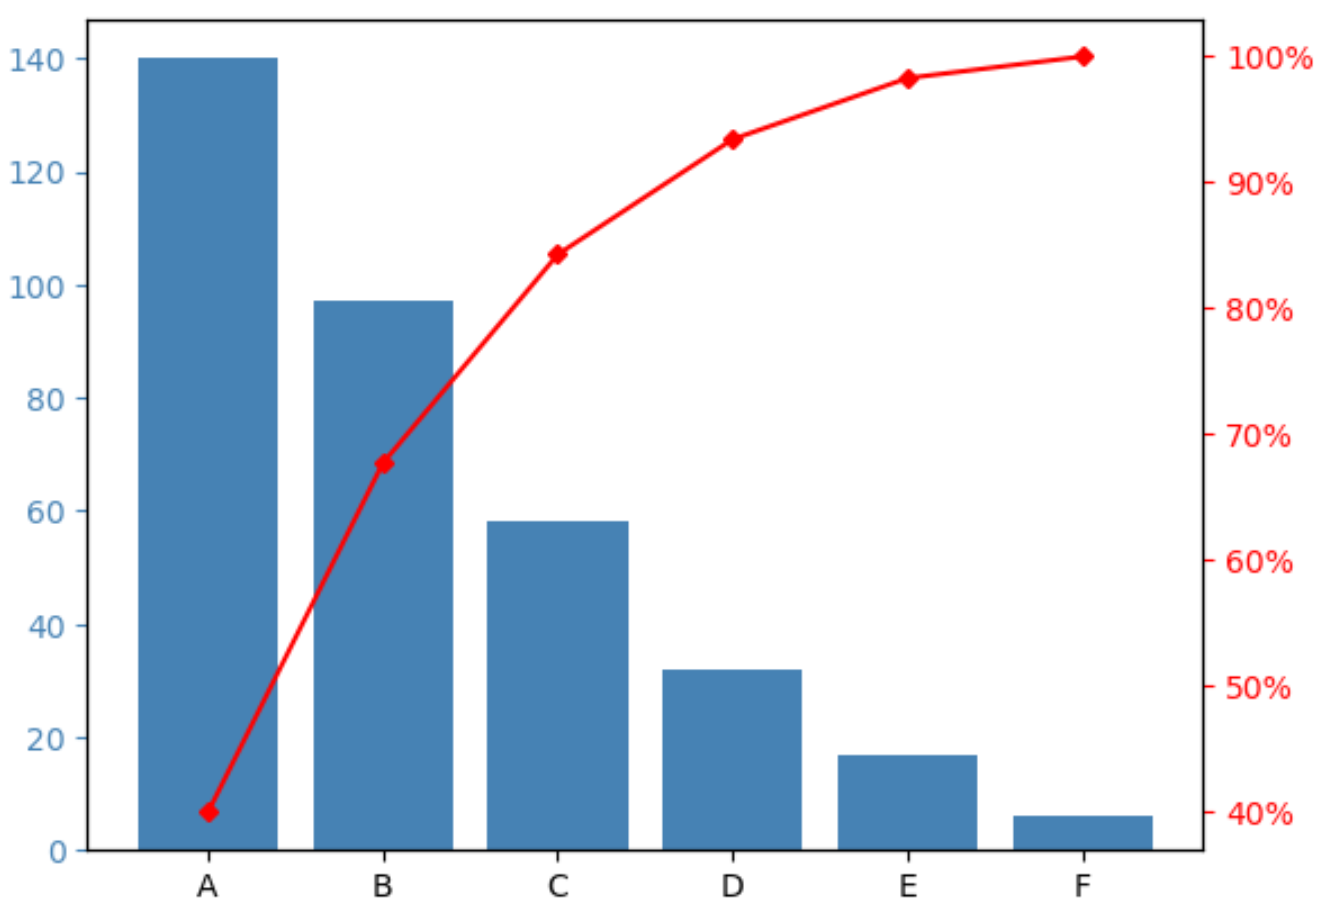
A bar chart with the bars ordered according to decreasing frequency enhanced by a line joining points above each bar giving the cumulative frequency. Pareto Plot Post navigation Parametric MethodsParking lot Test Leave a ReplyYour email address will not be published. Required fields are marked *Comment * Name Email Website