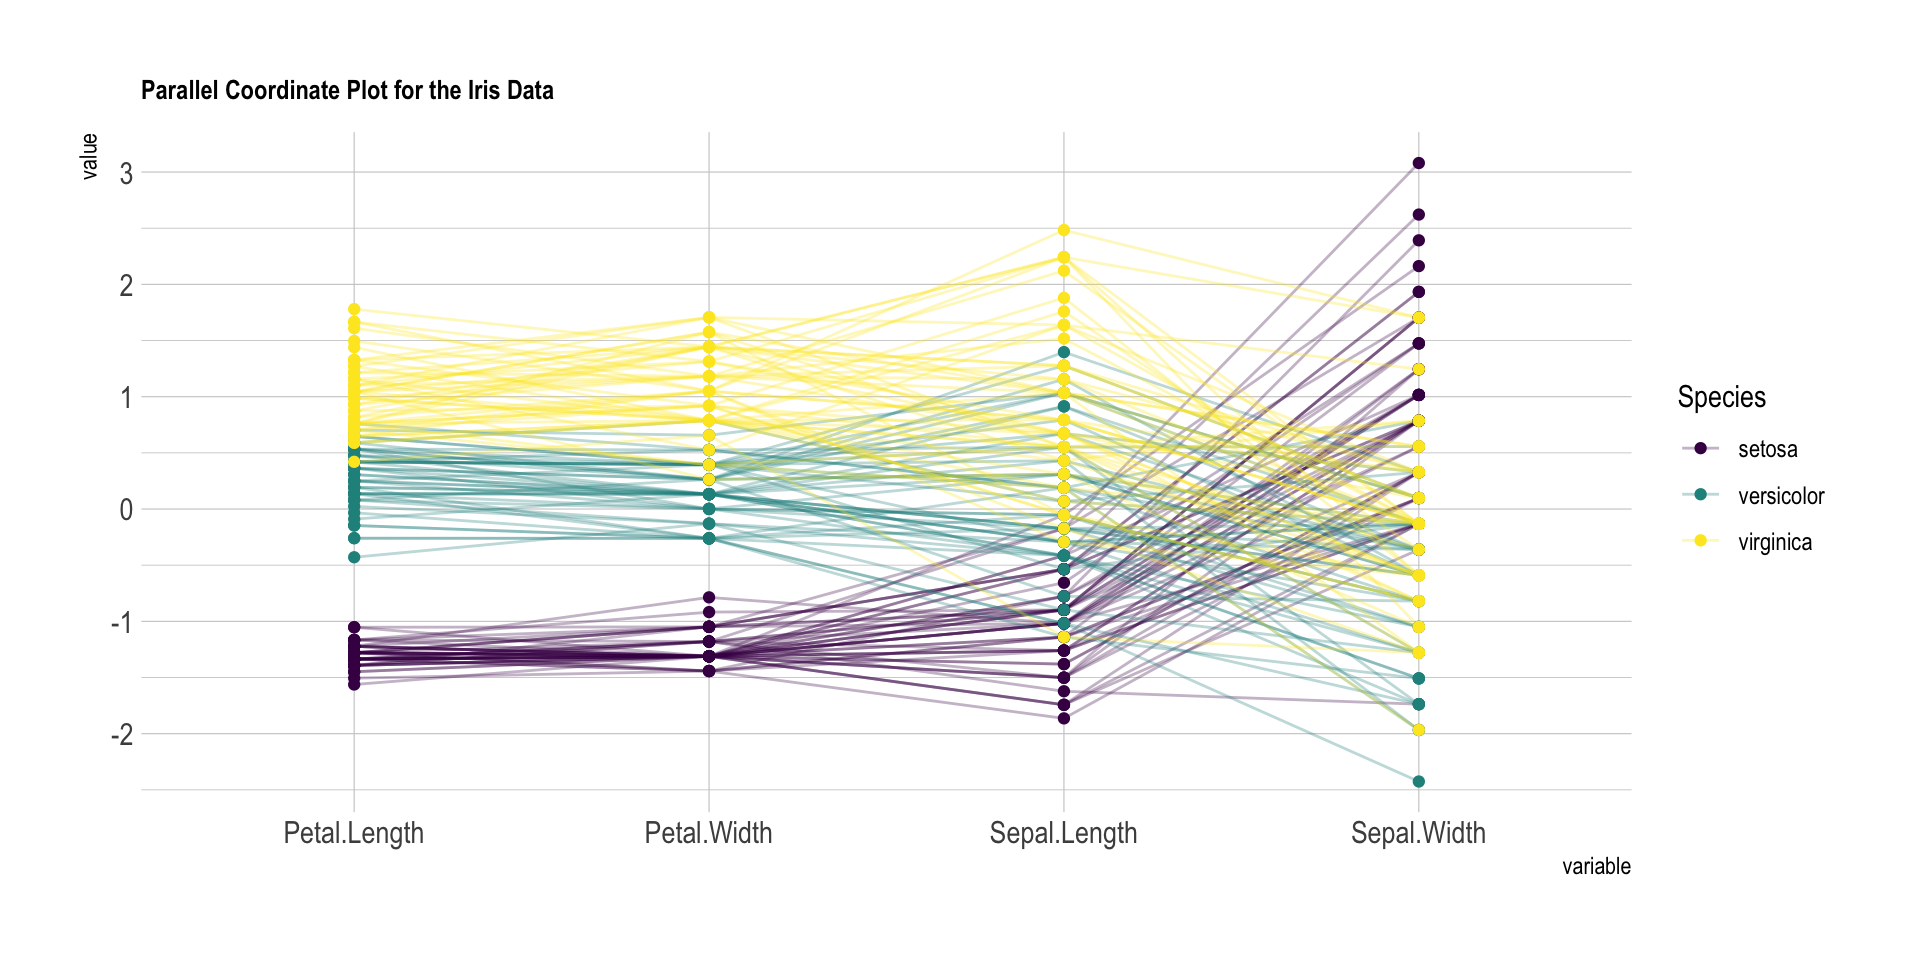
A simple but powerful technique for obtaining a graphical display of multivariate data. In this plot, the variable axes are arranged horizontally, each parallel to the one above it. A line is then plotted for each observation by joining the appropriate variable values on these axes.