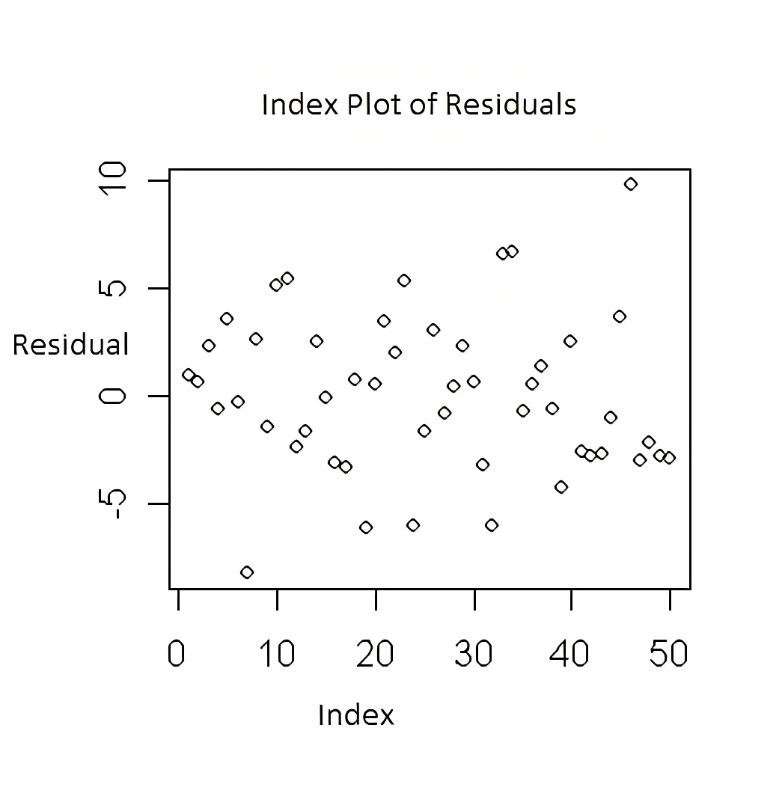
A plot of some diagnostic quantity obtained after the fitting of some model, for example, Cook’s distances, against the corresponding observation number. Particularly suited to the detection of outliers. Index Plot Post navigation Index NumberIndicator Variable Leave a ReplyYour email address will not be published. Required fields are marked *Comment * Name Email Website