A Critical Region, or CR, is a section of a statistical analysis where the null hypothesis is either accepted or rejected. The null hypothesis is a statement which states that there is no relationship between two variables, such as in an experiment.
Uses of Critical Region
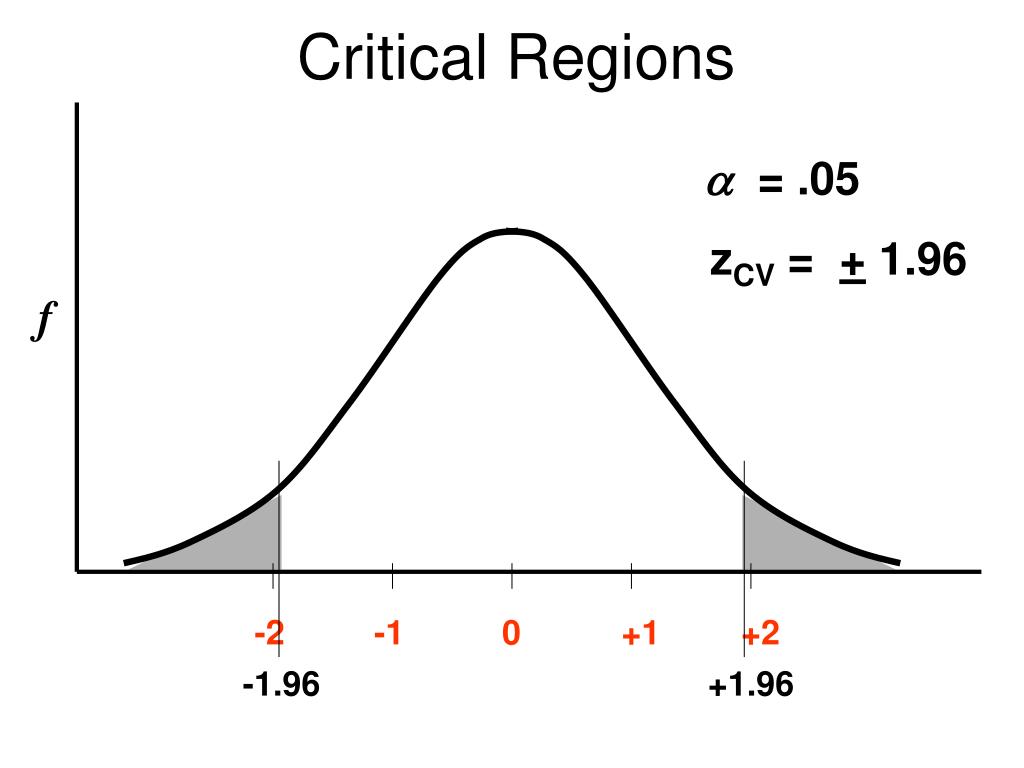
It can also be used for a comparison to see if the results of one sample are significantly different from another sample. Generally speaking, the critical region is defined by a certain probability level, such as 0.05 or 0.01 (known as alpha levels).
This means that if the results of the analysis determine that it falls into this range of probability, then it can be said that the null hypothesis has been rejected and some sort of significant difference exists between the groups being compared.
The use of CRs in statistics helps researchers evaluate whether or not their findings are valid and can help prevent them from making false claims when presenting their work to others. To further illustrate how this works consider an example involving two samples; one containing 15 people who have taken a drug while another contains 15 people who have not taken the drug. By running an analysis on these two samples a researcher may find that those who took the drug had better test scores than those who did not take it.
However, before they make any claims based on this result they must first check to see if it falls into the critical region set by their alpha level (i.e., 0.05). If it does not fall into this region then they must conclude that there was no significant difference between these two groups and therefore cannot draw any conclusions based on their findings.
Statistical Distribution Graph
Critical Region is a concept used to refer to the area on a statistical distribution graph which determines whether the null hypothesis should be accepted or rejected. In other words, it is the area of a graph which is used to decide if the result of an experiment or test is statistically significant. A Type I error, also known as a false positive, occurs when the null hypothesis is rejected even though it is true.
In this case, there would be an incorrect observation that the results of an experiment are statistically significant when in fact they are not. The probability of making this type of error can be calculated using the size and shape of the critical region along with various assumptions about the underlying distribution. The probability of making a Type I error depends largely on how stringent – or lenient – researchers make their critical region. If researchers set up a very small critical region then it may not allow for any true positives to be observed, leading to an increased likelihood that they will observe false positives instead.
Alternatively, if they set up a large critical region then this could lead to more false negatives being observed instead. Therefore, when setting up critical region it’s important for researchers to strike a balance between avoiding too many false positives while still allowing some true positives to be observed as well. In addition to considering the size and shape of the critical region, researchers must also consider the level of significance that they wish to use in their analysis.
This level will depend upon how confident they want? to be in rejecting or accepting their null hypothesis and is usually denoted by alpha (α). Generally speaking, lower values for alpha increase the difficulty of rejecting a null hypotheses and thereby reduce your chances for making a Type I error (i.e., observing false positives).
Advantages and Disadvantages
There are several advantages of using critical regions. First of all, critical regions allow multiple threads to access the same resource without interfering with each other. This can lead to significant performance improvements and better resource utilization, as threads can execute in parallel and avoid waiting for each other.
Secondly, critical regions can prevent race conditions, in which two or more threads try to modify the same resource at the same time, leading to unpredictable behavior or errors. Synchronization mechanisms ensure that only one thread can access the critical region at a time, thus enforcing a serialization of the operations.
However, there are also several disadvantages and risks associated with critical regions. The most obvious one is that they can introduce deadlocks, in which two or more threads are blocked waiting for each other to release the synchronization mechanism, and none of them can proceed. Deadlocks can lead to a complete program freeze or crash, and are notoriously difficult to debug and fix.
Another disadvantage of critical regions is that they can reduce the scalability and modularity of the code. In a distributed system, where multiple nodes or processes may access the same shared resources, critical regions may become bottlenecks or single points of failure. Moreover, critical regions may violate the principles of encapsulation and abstraction, as they expose the internal state of the shared resources to the external code, making it harder to reason about the correctness and reliability of the program.
Conclusion
In conclusion, critical regions are a powerful tool for managing concurrent access to shared resources, but they require careful design and implementation to avoid the pitfalls and trade-offs. Developers must balance the performance benefits of parallelism and the risks of data inconsistency, deadlocks, and structural complexity, and choose the appropriate synchronization mechanism for each critical region, based on the specific requirements and constraints of the system. Overall, Critical Region can help researchers determine whether experimental data supports or rejects their null hypothesis in order to reach valid conclusions about their research study.