Discriminant analysis is a classification technique that is commonly used to classify observations into one of two or more categories. This method is especially useful when the observations are numerical variables and can be used to separate groups of observations from each other based on the characteristics present in their data points.
Goal of Discriminant Analysis
The goal of discriminant analysis is to accurately predict group membership for new observations based on a set of known groupings. Discriminant analysis works by looking at the differences between groups within a dataset and attempts to find linear functions (or combinations of linear functions) that will best separate the groups from each other.
These linear functions are then used as decision boundaries, which can be used to predict group membership for new data points based on which side of the boundary they fall on. The first step in performing a discriminant analysis is to define the parameters that will be used to differentiate between groups and create a discriminant function.
The function should include all relevant variables, including mean values and standard deviations, for each group in order to provide an accurate representation of how each group differs from one another. Once this preliminary step has been completed, the next step is to calculate the separation distances between different groups using the equation: D = (X – μ1) / σ1 – (X – μ2) / σ2 where X represents an observation vector, μ1 and μ2 represent means for two different classes, and σ1 and σ2 represent standard deviation for two different classes.
This calculation provides insight into how much distance exists between different groups and provides information about which variables have significant differences within them. Once these calculations have been completed, it is possible to use various graphical techniques such as scatter plots or box plots to visualize the differences between groups.
Additionally, various statistical tests can be performed such as Wilks’ lambda or Hotelling’s T-squared test in order to determine if any observed differences between groups are statistically significant. These tests help ensure that any observed differences are not just due to chance but actually exist due to meaningful patterns in the data set.
Finally, discriminant functions can also be combined with other classification techniques such as logistic regression or support vector machines in order to improve prediction accuracy and reduce overfitting issues that may arise when using only one method on its own.
Overall, discrimination analysis provides an effective way of accurately classifying observations into one or more categories by looking at quantitative information present within datasets.
Confusion Matrix
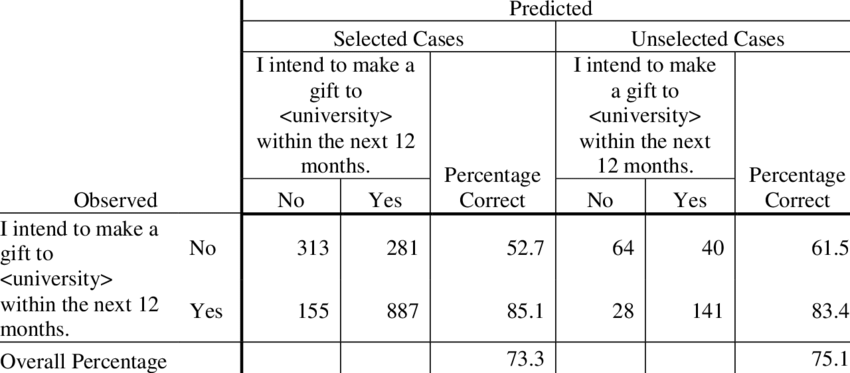
A classification matrix, also known as a confusion matrix, is a table used to evaluate the performance of a machine learning model. It displays the achieved outcomes (true positives, false positives, true negatives, and false negatives) in a clear and concise manner so that it is easier to understand the model’s strengths and weaknesses.
Advantages of using classification matrix
- Interpretability: The classification matrix is easy to interpret and understand. It provides a visual representation of how the model is performing, making it easy to see where the model is struggling and where it is excelling.
- Identifying errors: The matrix helps in identifying the type of errors a model is making, which can help data scientists improve the model’s performance.
- Comparison: The classification matrix can be used to compare different models and select the one that performs the best.
- Metrics calculation: From the classification matrix, several metrics can be calculated such as accuracy, precision, recall, and F1-score. These metrics are used to evaluate the performance of the model.
Disadvantages of using classification matrix
- Focus on binary classification: The matrix is designed for binary classification, and it becomes less useful as the number of classes increases.
- Imbalanced class’s issue: The matrix assumes that the classes are balanced, which is often not the case. If the classes are imbalanced, the matrix can provide a misleading representation of the model’s performance.
- Model bias: The matrix can be biased toward the majority class, and it becomes difficult to identify the minority class’s performance.
In summary, a classification matrix is a useful tool for evaluating the performance of machine learning models. However, like all tools, it has its advantages and disadvantages, which must be considered when using it.