The Chi-square test, also known as Pearson’s Chi-square test or the goodness-of-fit test, is a statistical method used to determine whether there is an association between two variables. It compares observed frequencies with expected frequencies in one or more categories of a variable. It is primarily used in experiments that involve categorical data and can be used to compare different distributions of categorical data to determine if they are related.
Working and Applications of Chi-square Test
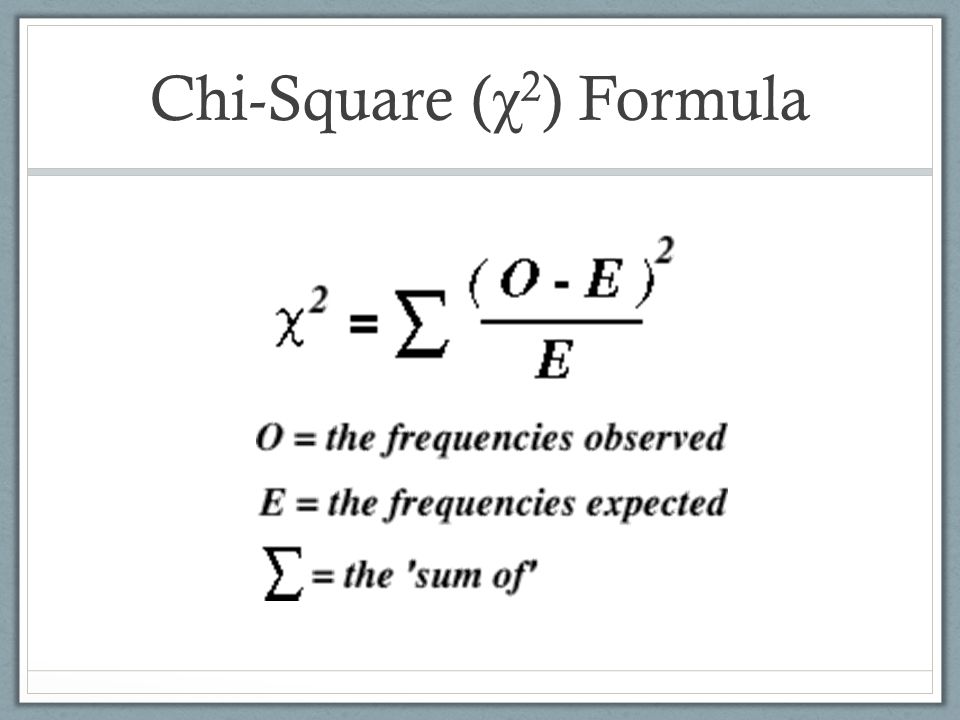
The chi-square test uses a chi-square statistic, which is calculated by subtracting the expected frequency from the observed frequency and then squaring it, dividing the result by the expected frequency and then adding up all of these values. This results in a number that indicates how closely the two variables correlate. The higher this number is, the greater difference there is between expected frequencies and observed frequencies, indicating that there may be some correlation between the two variables being studied. In addition to determining if two variables are correlated, the chi-square test can also help identify patterns within categorical data.
It can help answer questions such as “Is there a relationship between gender and political party?” If so, what kind? The chi-square test can also be used to compare different groups within one variable to each other (for example: “Are people born before or after 1990 more likely to vote for certain political parties?”). It should be noted that while useful in certain circumstances, the chi-square test does have limitations. In particular, this method does not take into account any form of sampling bias that may exist when studying a population – for example, if individuals who are easy to reach are overrepresented in a sample due to their availability (e.g., responding repeatedly to surveys), this could lead to inaccurate conclusions when using this method of analysis. Additionally, since this method works best on large datasets with many observations (hundreds or more), it can be difficult to use on smaller samples like those typically seen in social science research studies.
Advantages and Disadvantages
One of the main advantages of the chi-square test is its simplicity. It can be easily applied to both small and large sample sizes without requiring complex calculations or assumptions. This also makes it a very accessible statistical test, particularly for researchers and practitioners who may not have extensive statistical knowledge. Another advantage of the chi-square test is its versatility. It can be used to test the independence of two variables, as well as to determine if observed data fits a particular distribution. This makes it a useful tool in a variety of research contexts.
However, there are also some drawbacks to using the chi-square test. One of the main disadvantages is that it is sensitive to sample size. In general, larger sample sizes are needed to achieve the same level of statistical significance as smaller sample sizes. This can make it challenging to apply the chi-square test in certain research contexts where sample sizes may be limited. Another disadvantage of the chi-square test is that it assumes that observed data follows an exact or approximate distribution. If the data deviates significantly from the expected distribution, the test may produce inaccurate or biased results.
Conclusion
Overall, though it has its limitations, the chi-square test remains an important tool for analyzing relationships between variables and understanding patterns within categorical data. It has been widely utilized by researchers since its introduction over 100 years ago and continues to provide valuable insights into complex questions about our world today. The chi-square test is a valuable tool for researchers and practitioners seeking to test the independence of two variables or test for goodness of fit. However, it is important to be aware of its limitations and potential biases when interpreting results.