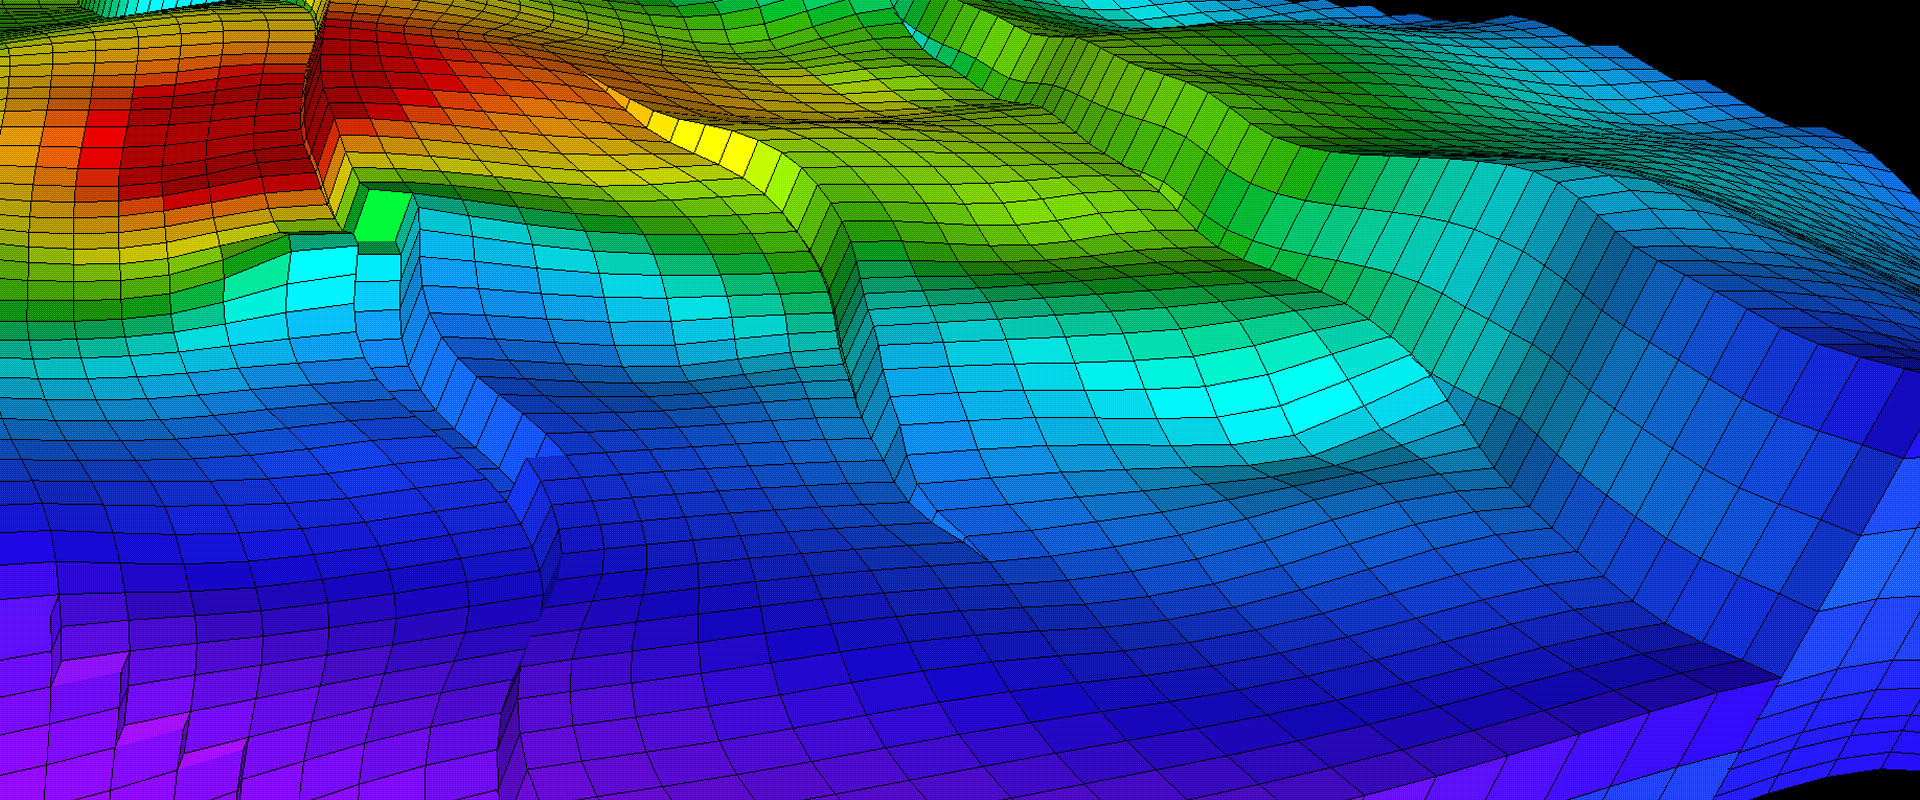
Dynamic graphics, also referred to as data visualization, is a type of computer-generated graphic whose visual representation is derived from data that can change over time. This method of visualizing information makes it possible to quickly identify trends and patterns in large datasets. It allows for the exploration of complex relationships between different variables and helps us to understand how they are related. Dynamic graphics are used in many different fields including science, economics, engineering, journalism, business intelligence, and education. Dynamic graphics use various technologies such as 3D modelling, animation, interactivity and game engines to create compelling visual results from the underlying data. This type of visualization allows users to quickly identify patterns that may not be apparent through examination of static images or tables. Through the use of advanced graphical techniques such as scale-dependent display rules and zooming effects, dynamic graphics can provide an intuitive way for users to explore and understand large amounts of data quickly. In addition to helping identify trends or patterns that may be hidden in large datasets, dynamic graphics have also been used to improve decision making by providing meaningful information in a more visually appealing format than traditional charts or graphs. By providing more context for complex information – such as a map showing locations of stores with varying levels of customer satisfaction – dynamic graphics can help managers make decisions faster and more effectively by enabling them to see relationships between multiple variables at once. Dynamic graphics may also be used in other types of applications such as medical imaging or environmental monitoring systems where real-time feedback must be provided quickly while still allowing users to explore the underlying data in detail. This type of visualization has become increasingly popular due to its ability to help users gain insights into their data without having to guess or rely solely on intuition. For example, weather forecasting software uses dynamic graphics technology so that meteorologists can visualize atmospheric conditions over time more efficiently than before. In conclusion, dynamic graphics are an important tool for exploring complex relationships between variables quickly and effectively by using sophisticated techniques such as 3D modelling and animation technology. Whether it’s used in decision making processes or medical imaging applications – this type of visualization provides an intuitive way for users to explore large datasets efficiently while gaining insights into the underlying data at the same time.
Dynamic graphics, also referred to as data visualization, is a type of computer-generated graphic whose visual representation is derived from data that can change over time. This method of visualizing information makes it possible to quickly identify trends and patterns in large datasets. It allows for the exploration of complex relationships between different variables and helps us to understand how they are related.
Uses of Dynamic Graphics
Dynamic graphics are used in many different fields including science, economics, engineering, journalism, business intelligence, and education. Dynamic graphics use various technologies such as 3D modelling, animation, interactivity and game engines to create compelling visual results from the underlying data. This type of visualization allows users to quickly identify patterns that may not be apparent through examination of static images or tables.
Dynamic graphics may also be used in other types of applications such as medical imaging or environmental monitoring systems where real-time feedback must be provided quickly while still allowing users to explore the underlying data in detail. This type of visualization has become increasingly popular due to its ability to help users gain insights into their data without having to guess or rely solely on intuition. For example, weather forecasting software uses dynamic graphics technology so that meteorologists can visualize atmospheric conditions over time more efficiently than before.
Benefits of using Dynamic Graphics
The advantage of dynamic graphics is that they can convey a lot of information in a single image, using animations and visual cues to illustrate complex concepts and ideas. This greatly improves comprehension and helps to simplify the message, making it easier for the audience to understand. Through the use of advanced graphical techniques such as scale-dependent display rules and zooming effects, dynamic graphics can provide an intuitive way for users to explore and understand large amounts of data quickly.
In addition to helping identify trends or patterns that may be hidden in large datasets, dynamic graphics have also been used to improve decision making by providing meaningful information in a more visually appealing format than traditional charts or graphs. By providing more context for complex information – such as a map showing locations of stores with varying levels of customer satisfaction – dynamic graphics can help managers make decisions faster and more effectively by enabling them to see relationships between multiple variables at once.
Disadvantages
However, there are also some disadvantages to using dynamic graphics. They can be more difficult to create and require specialized skills and software. Additionally, they can be more resource-intensive, requiring higher bandwidth and processing power to display properly. Despite these challenges, dynamic graphics are becoming increasingly popular in today’s content-driven world. They offer a unique and engaging way to communicate complex information and engage with audiences in new and exciting ways. As technology continues to evolve, we can expect to see even more innovative uses of dynamic graphics in a wide range of contexts.
Conclusion
In conclusion, dynamic graphics are an important tool for exploring complex relationships between variables quickly and effectively by using sophisticated techniques such as 3D modelling and animation technology. Whether it’s used in decision making processes or medical imaging applications – this type of visualization provides an intuitive way for users to explore large datasets efficiently while gaining insights into the underlying data at the same time.

